Tricolor-problem
Description
This case study shows a model of the well-known NP-complete problem of 3-col, by means of the so called simple Kernel P systems (skP systems).
Model
The corresponding P-Lingua file is the following:
@model<simple_kernel_psystems>
def main()
{
  call three_colouring(n);
}
def three_colouring(n)
{
  call init_cells();
  call init_multisets(n);
  call init_rules(n);
}
def init_cells()
{
  @mu = [[]'1 []'2]'0;
}

def init_rules(n)
{
  /*r1,i*/      [X{i}]'1 --> [X{i+1}]'1 : 1<=i<=(2*n+2);
  /*r1,2*n+3*/  [a,T]'1 --> [yes]'0;
  /*r1,2*n+4*/  @guard {>=-T} ? [a,X{2*n+3}]'1 --> [no]'0;

  /*r2,2*i-1*/  @guard {=+s} ? [A{i}]'2 |--> [R{i},A{i+1}]'2 [T{i}]'2  : 1<=i<=(n-1);
  /*r2,2*i*/    @guard {=+s} ? [T{i}]'2 |--> [B{i},A{i+1}]'2 [G{i},A{i+1}]'2 : 1<=i<=(n-1);
  /*r2,2*n-1*/  @guard {=+s} ? [A{n}]'2 |--> [R{n},X]'2 [T{n}]'2;
  /*r2,2*n*/    @guard {=+s} ? [T{n}]'2 |--> [B{n},X]'2 [G{n},X]'2;

  /*r2,2*n+1*/  @guard |{{=+A{l1,m1}}&&{=+B{l1}}&&{=+B{m1}}&&{=-A{l1,l1}}}:{1<=m1<=(n),1<=l1<=(n-1)} ||
  |{{=+A{l2,m2}}&&{=+G{l2}}&&{=+G{m2}}&&{=-A{l2,l2}}}:{1<=m2<=(n),1<=l2<=(n-1)} ||
  |{{=+A{l3,m3}}&&{=+R{l3}}&&{=+R{m3}}&&{=-A{l3,l3}}}:{1<=m3<=(n),1<=l3<=(n-1)} ?
                                [s]'2 --> []'2;
  /*r2,2*n+2*/  [X]'2 --> [Y]'2;
  /*r2,2*n+3*/  [Y,s]'2 --> [T]'1;
}

def init_multisets(n)
{
  {
  @ms(1) = a, X{1};
  @ms(2) = A{1}, s;
  };
  @ms(2) += A{e{i,1},e{i,2}} : 1<=i<=ne;
}
Environment
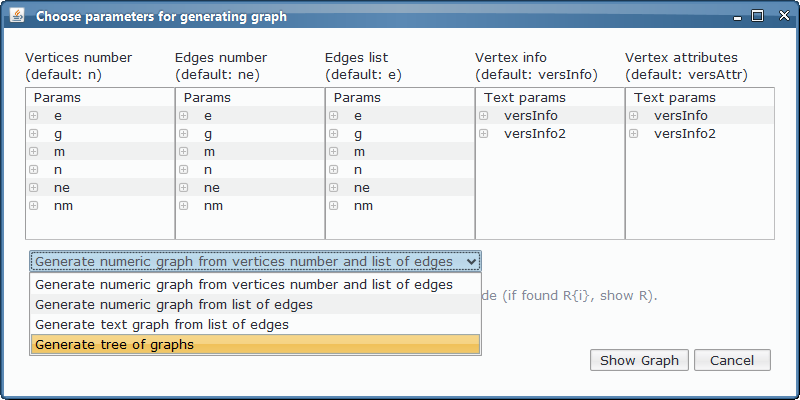
In order to work with the model, a custom app is defined in MeCoSim (in its .xls file, see :ref:files), defining the configuration to generate the visual input tables allowing us to introduce the data of a specific scenario (that is, a graph), along with the output tables, to show the relevant results of the computation. Apart from the visual elements, some other settings in xls file will define the mechanism to convert input data into parameters for instantiating the P system, and to select the desired information from th computation to generate the outputs.
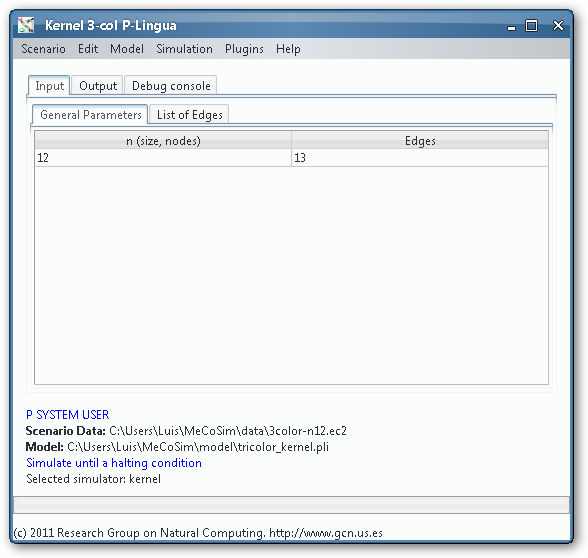
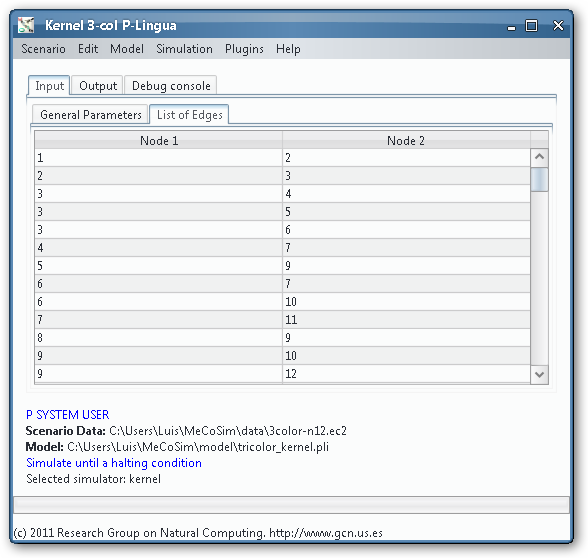
Input tables
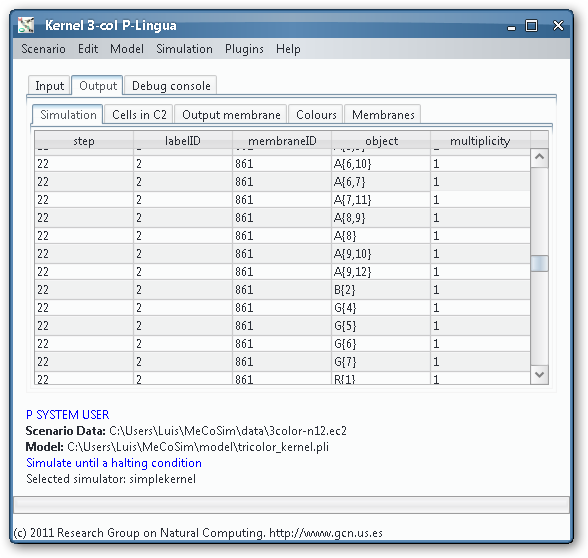
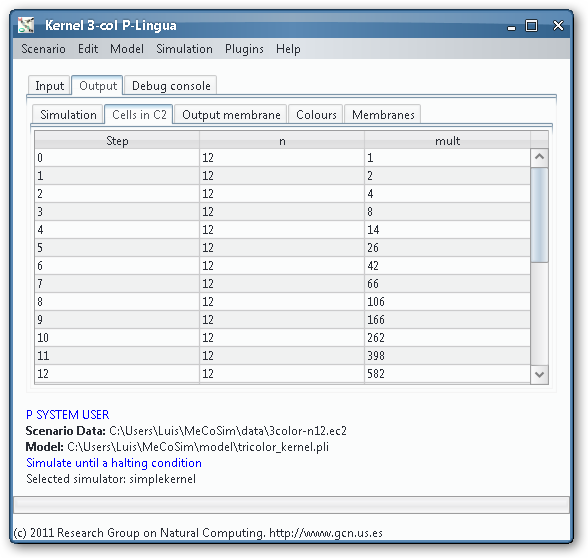
Output tables
Needed files
A first run
In order to load, parse and simulate this model, we need several files:
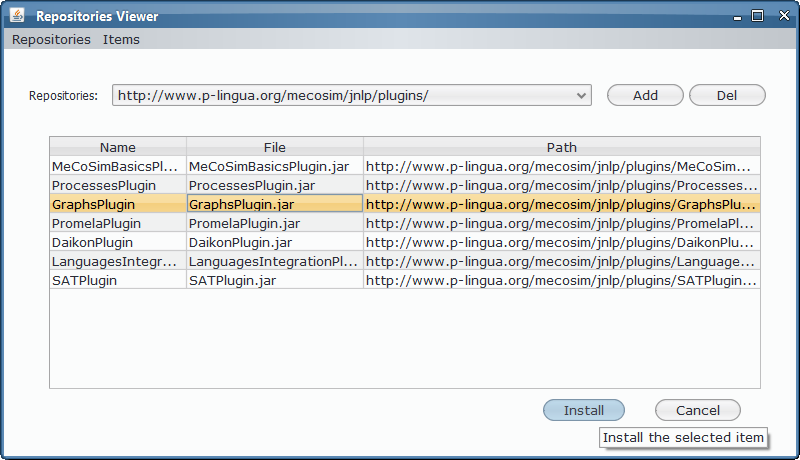
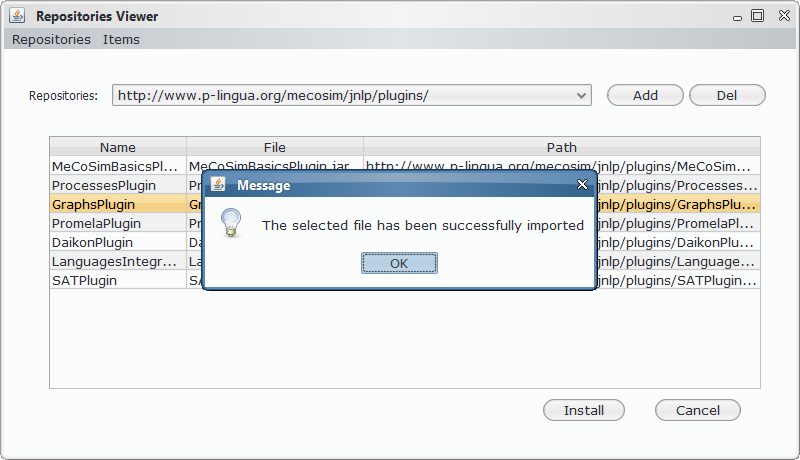
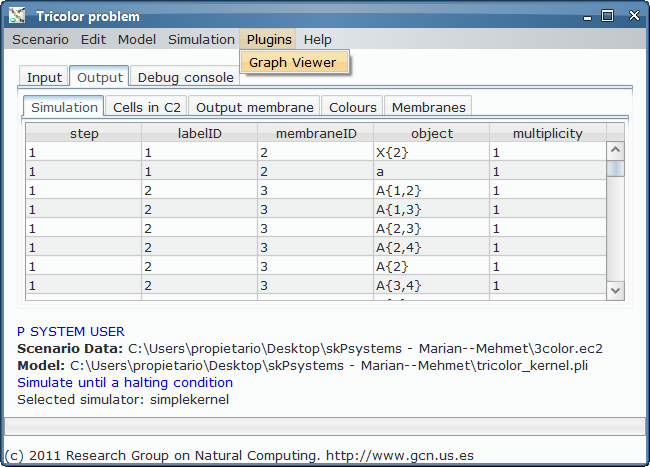
- Custom application, defining the interface with the needed input and output tables for 3-col problem, along with some custom graphs. Install Graphs plugin in order to see the visual representation of the graph and its possible colourations.
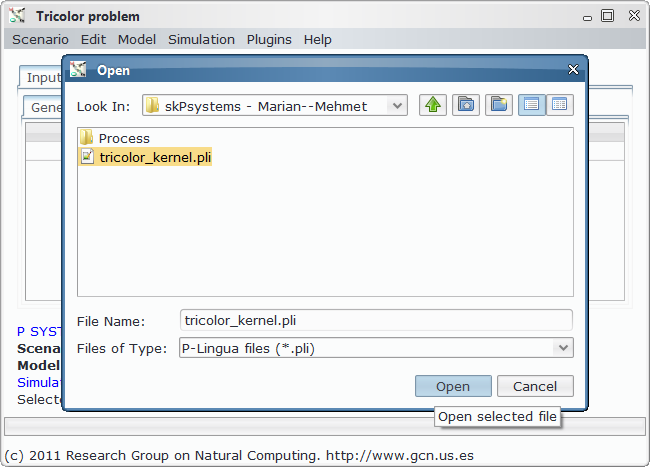
- Model file, P-Lingua file with the parametrized file specifying the family of P systems for solving the 3-col problem. The custom interface enable the user to introduce the data corresponding to each different scenario.
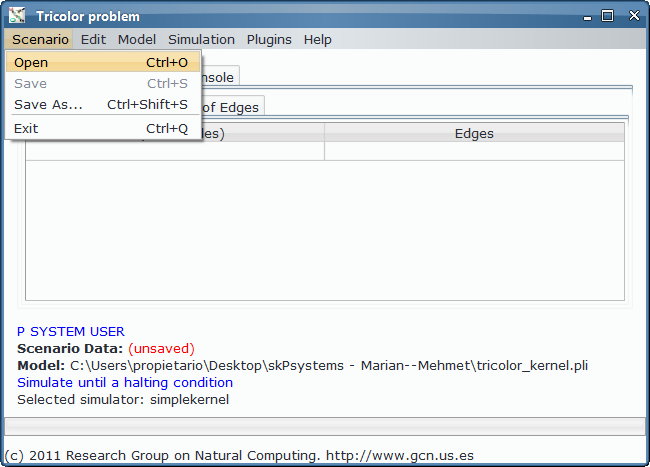
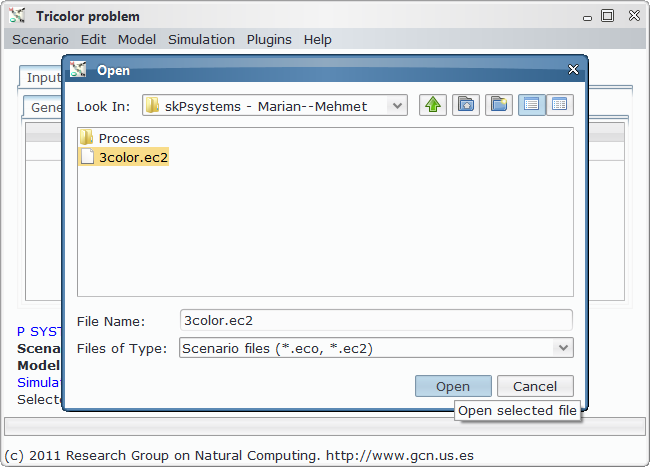
- Scenario file, for a specific instance of the problem (that is, a specific graph to colour).
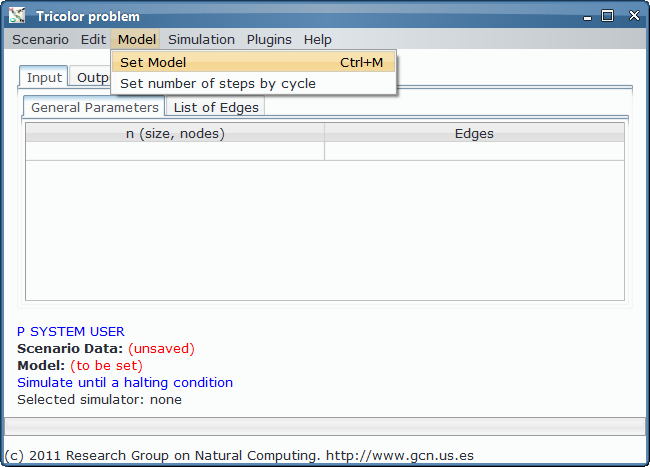
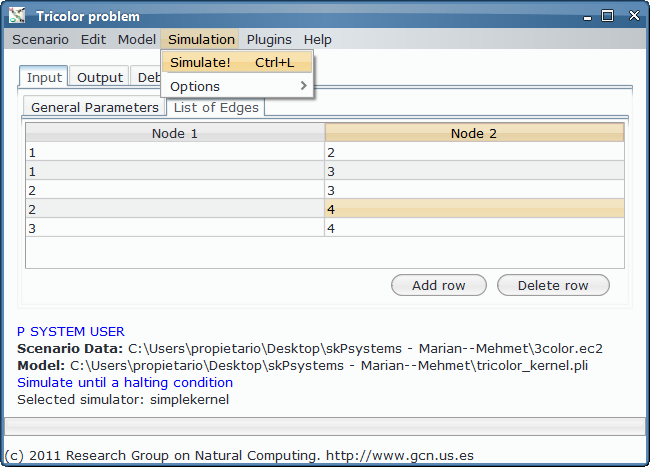
Step by step screenshots
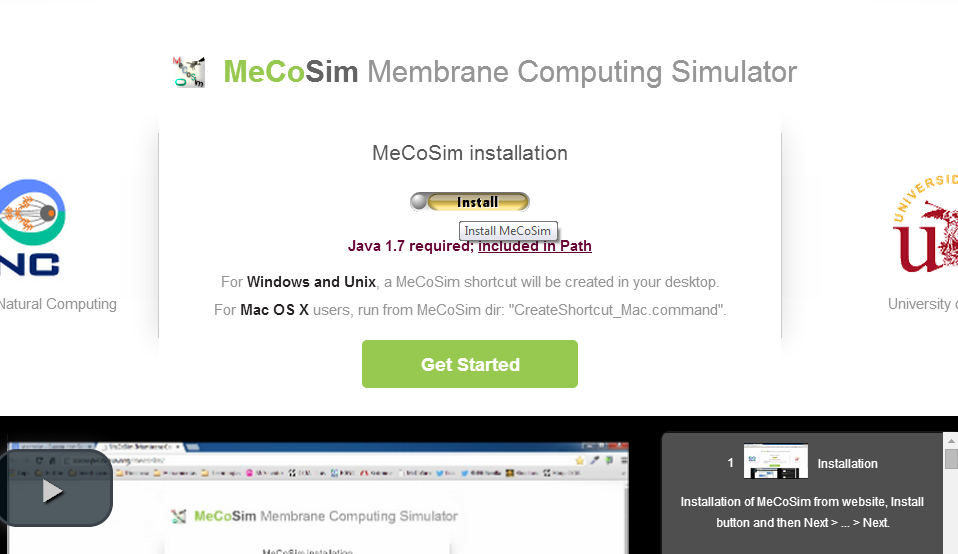
- Installation of MeCoSim and Graphs plugin, if not installed:
- MeCoSim:
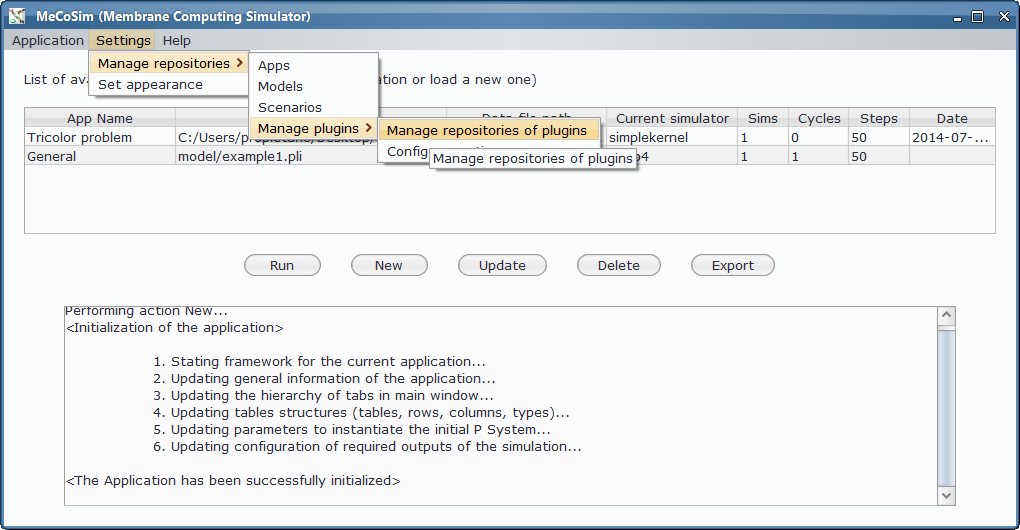
- Graphs plugin
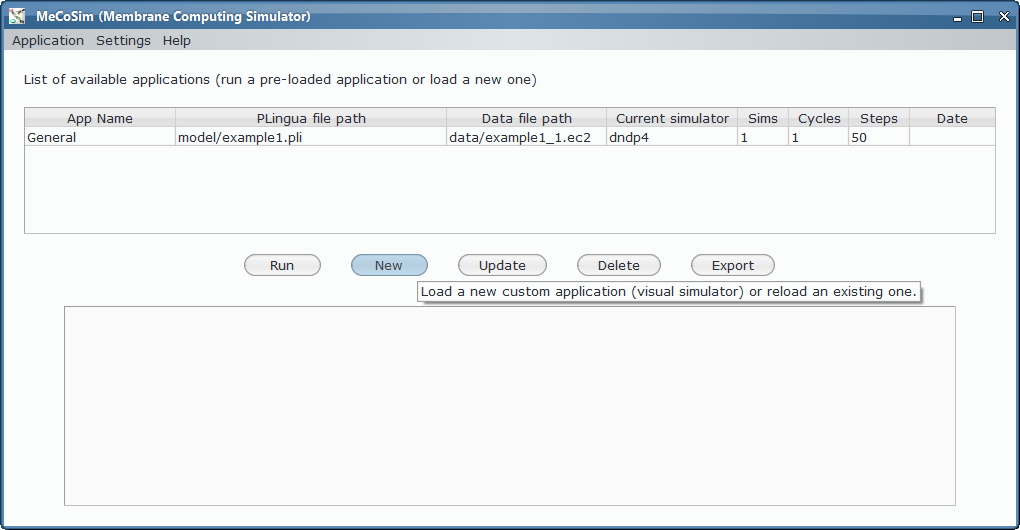
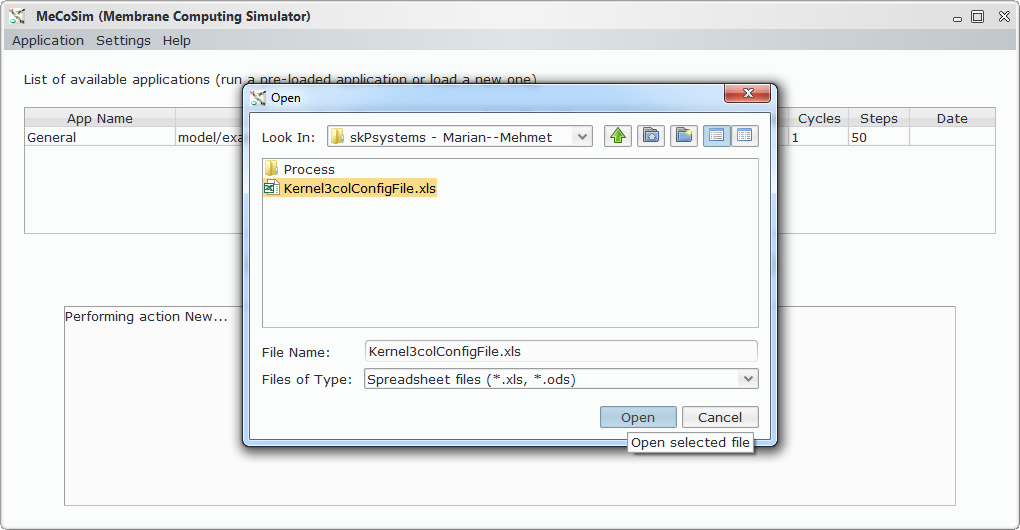
- Custom app running, model setting and scenario opening:
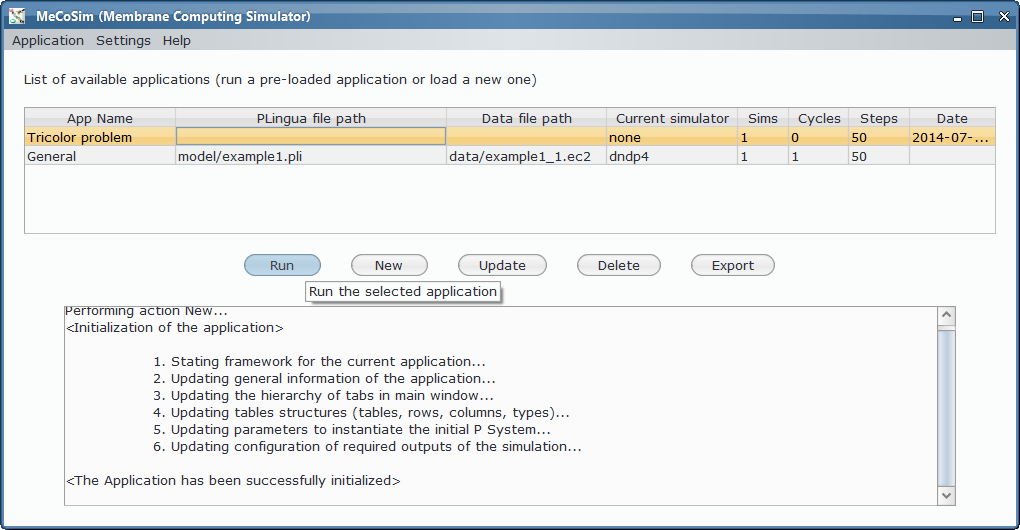
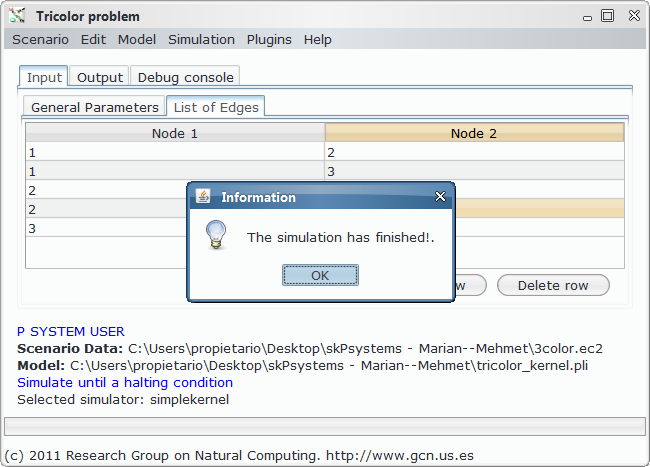
- Simulation and output generation:
Additional files
Some alternative custom apps are provided in order to show the right output data in different situations:
- Custom app for simulating with Spin, given that when choosing simulator “simplekernelpromela” in MeCoSim the objects and membranes in Spin output do not have exactly the same representation.
- Custom app for extracting to Daikon. It is the same original custom app, but enabling the extraction of data for Daikon invariant detector. The extraction files are generated during the simulation, and the results can be visualized by means of Daikon plugin (if not installed, it can easily be done inside MeCoSim from repositories manager, see video).
- Custom app for tissue. Tissue model includes objects of type R{i,j}, G{i,j} and B{i,j}, so they are excluded from the custom output with the colours, used as an output table but also as a source for generating the colouration graphs usable from Graph plugin - option Generate tree of graphs, showing a graph for each membrane and step of the computation.
Some alternative models have been developed and simulated. The model files are listed here:
- Kernel model 2, using membrane relabelling.
- Halt model, incorporating special halt objects for stopping the computation when no rule is being applied in compartments of type 2. If an object called halt appears, the simulation stops.
- Dissolution model, incorporating dissolution rules when a non-solution membrane is detected. Thus, after the end of the simulation, it can be shown with Multisets viewer (part of MeCoSim basics plugin) that only membranes 2 capturing solutions are present in the final configuration.
- Tissue model, for more info see :ref:references.
Here we provide some additional scenarios:
- Petersen graph.
- Non colorable graph, with 25 nodes including an initial set of nodes making the graph non colorable.
- “Inverse” minimal graph, with 4 nodes, and edges from all the nodes to the last node.
- Minimal graph, with 6 nodes, and edges from the first node to the rest.
- Complete graph, with 8 nodes.
Simulation
This section shows a detailed study of experiments being simulated with MeCoSim, for different instances of 3-col problem (that is, different graphs), with a number of variants of the initial model (kernel 1), including some ingredients like halting symbol or dissolution, and also comparing with model kernel 2 and tissue.
Note: some visualization problems may appear below as a consequence of the use of scrolling in this embed page. To avoid this unfriendly effect you can view the results in their own page.
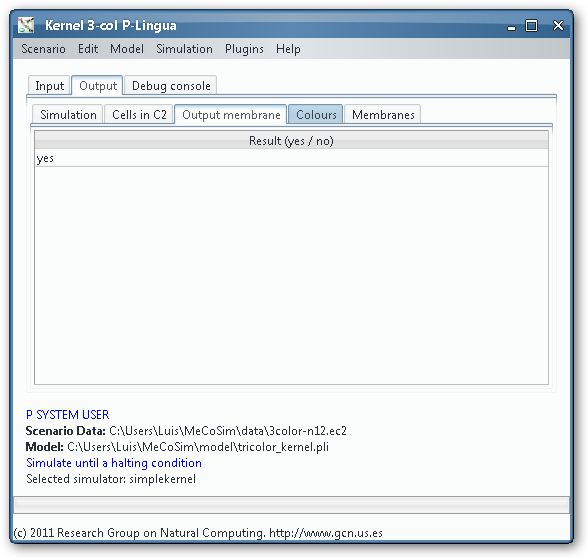
Results
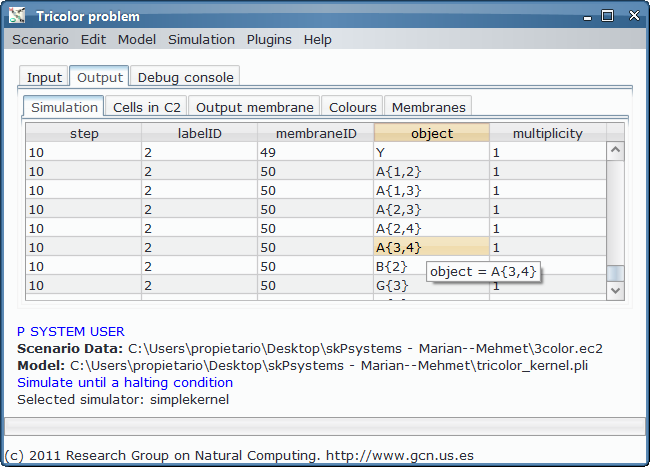
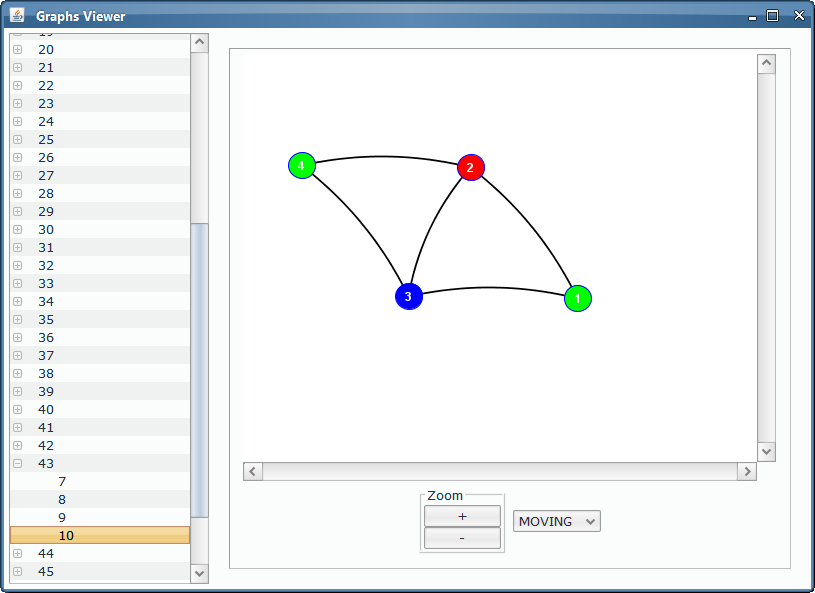
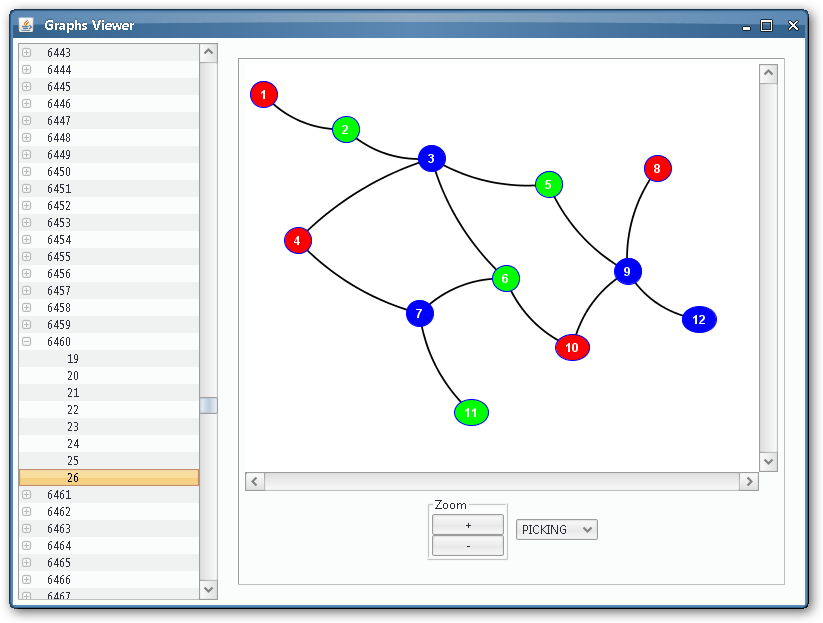
As we could see from the third output table screenshot, the P system is returning yes, so it is possible to colour the input graph with 3 colours. Which is that colouring? We can take advantage of the Graphs Viewer to look at the contents of the membranes in a graphical way, more illustrative that the massive data present in the output tables, given that we are treating with an NP-complete problem.
Thanks to the visual tools, we can see easily if a given membrane contains a successful or unsuccessful colouring.
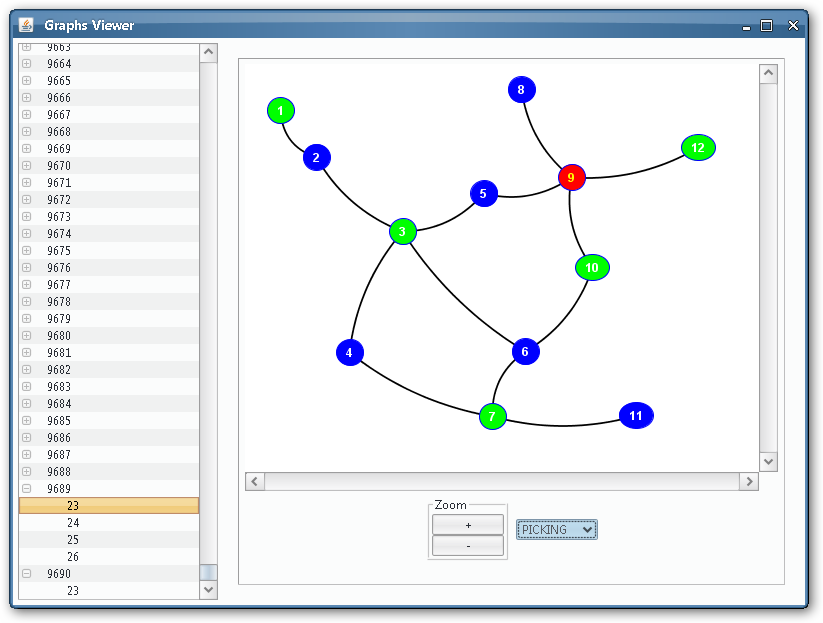
Unsuccessful colouring
As we can see, some of the membranes will allocate objects representing non-valid colourings:
Formal verification
This section shows a deep study of formal verification of certain properties in the presented model.
The properties are written in Promela language (see .pml file), and runs by means of the Spin model checker.
Note: some visualization problems may appear below as a consequence of the use of scrolling in this embed page. To avoid this unfriendly effect you can view the results in their page.
References
- 3-COL problem modelling using simple Kernel P systems (detailed publication info).
- Towards an Integrated Approach for Model Simulation, Property Extraction and Verification of P Systems (detailed information).
- Solving 3-COL with Tissue P Systems (detailed info).
- A uniform family of tissue P systems with cell division solving 3-COL in a linear time (detailed).
