|
|
|
|
|
|
|
|
|
| Comparison simple
Kernel - Tissue |
|
| scenario |
Arbitrary |
|
| run |
End |
|
|
| . |
Models |
|
|
|
|
|
|
|
|
Kernel 1 |
|
Total Kernel 1 |
Kernel 2 |
|
Total Kernel 2 |
Tissue |
Total Tissue |
| n |
No |
Yes |
|
No |
Yes |
|
No |
|
| 4 |
350 |
49 |
399 |
480 |
53 |
533 |
1200 |
1200 |
| 6 |
272 |
63 |
335 |
700 |
125 |
825 |
24086 |
24086 |
| 8 |
4812 |
325 |
5137 |
9200 |
500 |
9700 |
632092 |
632092 |
| 12 |
|
36050 |
36050 |
|
38147 |
38147 |
|
|
|
| N |
Kernel1 |
Kernel2 |
Tissue |
|
N |
4 |
6 |
8 |
| 4 |
49 |
53 |
1200 |
|
K1 |
49 |
63 |
325 |
| 6 |
63 |
125 |
24086 |
|
K2 |
53 |
125 |
500 |
| 8 |
325 |
500 |
632092 |
|
Tissue |
1200 |
26650 |
651979 |
|
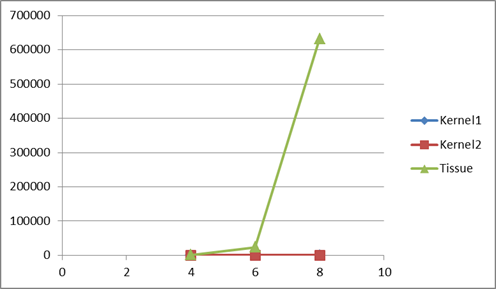
| We
cannot see the blue and red lines for having so different magnitude order,
when comparing with the times in tissue. |
|
|
|
|
|
|
|
|
|
|
|
|
|
|
|
|
|
|
|
|
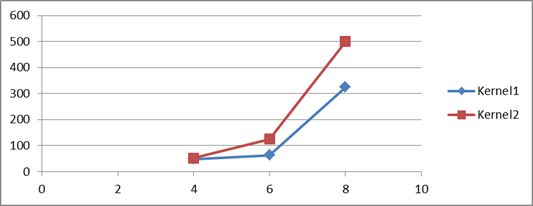
| Here we see
the evolutionof the models of Kernel 1 & 2 |
|
|
| N |
Kernel1 |
Kernel2 |
|
| 4 |
49 |
53 |
|
| 6 |
63 |
125 |
|
| 8 |
325 |
500 |
|
|
|
|
|
|
|
|
|
|
|
|
|
|
|
|
|
|
|
|
|
|
|